All official European Union website addresses are in the europa.eu domain.
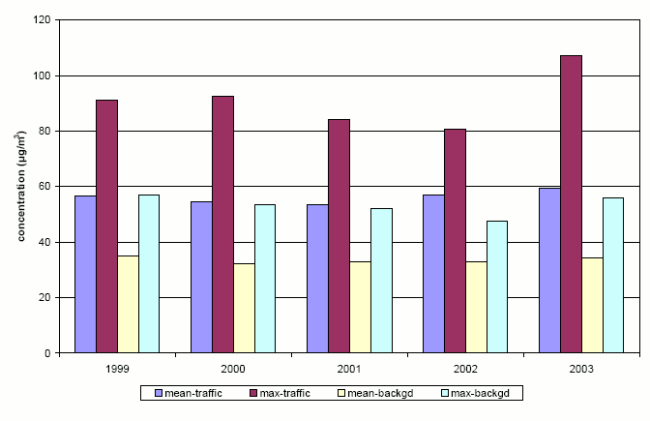
Chart (static)Published 05 Jul 2010Modified 20 Sept 2024