All official European Union website addresses are in the europa.eu domain.
See all EU institutions and bodiesAn official website of the European Union | How do you know?
Environmental information systems
EN
- БългарскиBG
- češtinaCS
- HrvatskiHR
- danskDA
- NederlandsNL
- ελληνικάEL
- EnglishEN
- eestiET
- SuomiFI
- FrançaisFR
- DeutschDE
- magyarHU
- ÍslenskaIS
- italianoIT
- LatviešuLV
- lietuviųLT
- MaltiMT
- NorskNO
- polskiPL
- PortuguêsPT
- RomânăRO
- slovenčinaSK
- SlovenščinaSL
- EspañolES
- SvenskaSV
- TürkçeTR
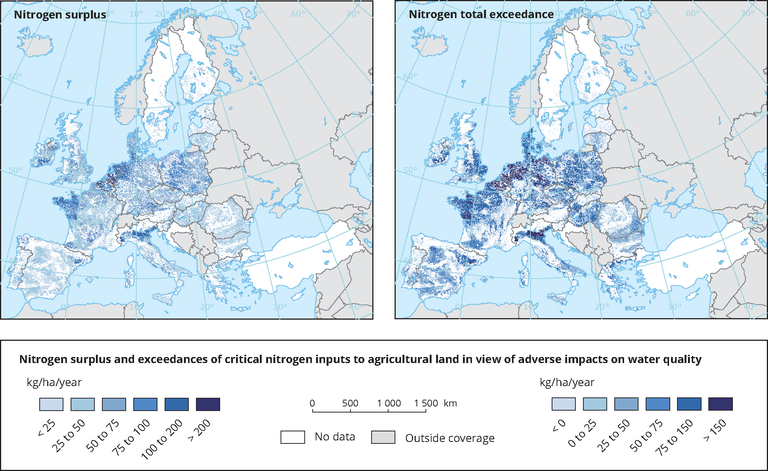
Nitrogen surplus and exceedances of critical nitrogen inputs to agricultural land in view of adverse impacts on water quality
Map (static)
The map shows the calculated nitrogen surplus (inputs minus crop removal) and exceedance of critical nitrogen inputs to agricultural land in view of adverse impacts on water
Downloads
Data sources
Metadata
More info
Loading
- Impacts of nutrients and heavy metals in European agriculture (Dataset URL is not available)
Methodology
Spatial distribution of nitrogen (N) surplus in EU27 for the year 2010, as calculated with the model INTEGRATOR.
Spatial distribution of the exceedance of critical N inputs in view of adverse impacts on water quality in EU27 for the year 2010, as calculated with the model INTEGRATOR.
Footnote for both maps: Data on: (i) manure application, affecting N inputs, is based on livestock statistics from EUROSTAT, (ii) fertilizer N inputs and crop yields , affecting N uptake, are based on FAOstat.
Calculations are done with the model INTEGRATOR. NCUs (Nitrogen Calculation Units), being sub-divisions of NUTS3 regions, are unique combinations of soil type, administrative region, slope class and altitude class composed of clusters of 1 km x 1 km pixels.
Additional information
Abstract maps and data on N surplus
The nitrogen (N) surplus in EU27 for the year 2010 was calculated as the total N input, by fertilizer, manure, biosolids, N fixing crops and deposition, minus the uptake of N with the model INTEGRATOR. The calculation was carried out for approximately 40.000 NCUs (Nitrogen Calculation Units). NCUs are unique combinations of soil type, administrative region, slope class and altitude class, composed of clusters of 1 km x 1 km pixels, NUTS3 regions. Data on: (i) manure application, affecting N inputs, is based on livestock statistics from EUROSTAT, (ii) fertilizer N inputs are based on FAOstat and (iii) subnational crop yields, affecting N uptake, are based on a combination of FAOstat and GYGA crop yield data. The model and data used to calculate N inputs and N uptake are given in De Vries et al. (2019b).
Abstract maps and data on exceedance of critical N inputs
The exceedances of critical N inputs to agricultural land in EU27 for the year 2010 was calculated as the total N input by fertilizer, manure, biosolids, N fixing crops and deposition minus the critical N input in view of adverse impacts on water quality. The critical N input was based on a critical N concentration in runoff to surface water of 2.5 mg N/l . The calculation was carried out for approximately 40.000 NCUs (Nitrogen Calculation Units). NCUs are unique combinations of soil type, administrative region, slope class and altitude class, composed of clusters of 1 km x 1 km pixels, NUTS3 regions. Data on: (i) manure application, affecting N inputs, is based on livestock statistics from EUROSTAT, (ii) fertilizer N inputs are based on FAOstat and (iii) subnational crop yields, affecting N uptake, are based on a combination of FAOstat and GYGA crop yield data. The model and data used to calculate N inputs, N uptake and N runoff are given in De Vries et al. (2019b).
The maps are to be published in:
The maps are to be published in
De Vries, W., P.F.A.M. Römkens J. Kros, J.C Voogd, G. Louwagie and L Schulte-Uebbing, 2019a. De Vries, W., J. Kros Impacts of nutrients and heavy metals in European agriculture. Current and critical inputs in view of air, soil and water quality. ETC/ULS Report (in press).