All official European Union website addresses are in the europa.eu domain.
See all EU institutions and bodies
An official website of the European Union | How do you know?
Environmental information systems
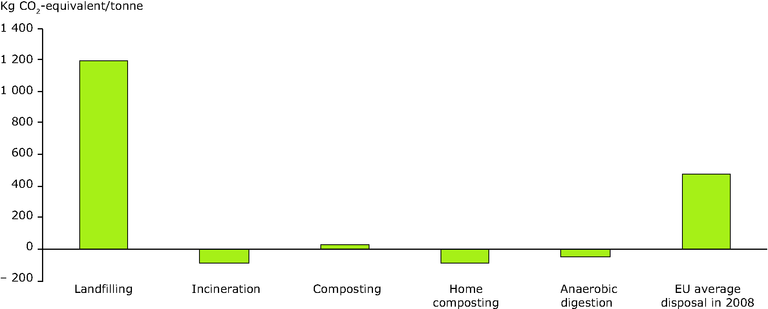
This figure identifies the net emission in CO2 equivalents for the treatment of 1 tonne of kitchen and garden waste for each of the 5 treatment options: landfilling, incineration, composting, home composting and anaerobic digestion. The average EU treatment mix in 2008 is also included.
Loading