All official European Union website addresses are in the europa.eu domain.
See all EU institutions and bodiesAn official website of the European Union | How do you know?
Environmental information systems
EN
- БългарскиBG
- češtinaCS
- HrvatskiHR
- danskDA
- NederlandsNL
- ελληνικάEL
- EnglishEN
- eestiET
- SuomiFI
- FrançaisFR
- DeutschDE
- magyarHU
- ÍslenskaIS
- italianoIT
- LatviešuLV
- lietuviųLT
- MaltiMT
- NorskNO
- polskiPL
- PortuguêsPT
- RomânăRO
- slovenčinaSK
- SlovenščinaSL
- EspañolES
- SvenskaSV
- TürkçeTR
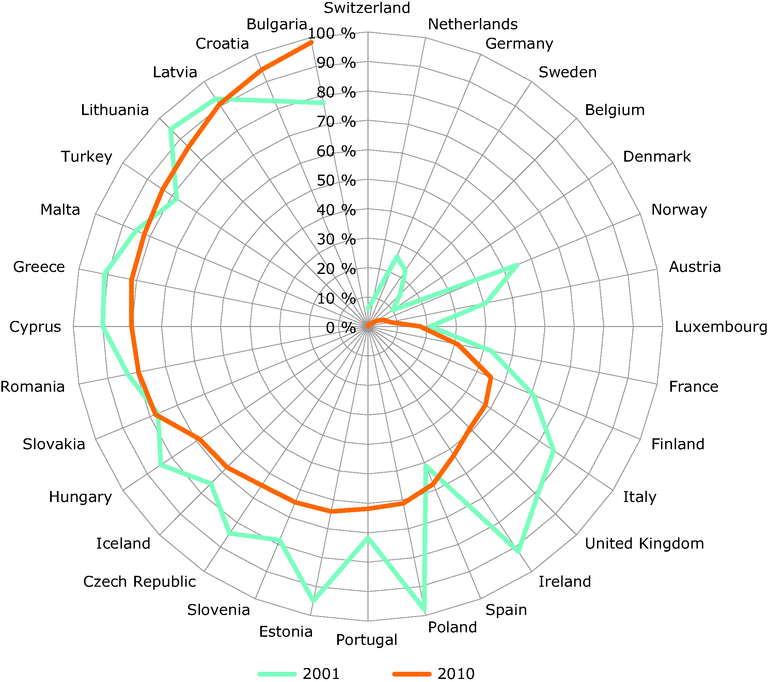
Municipal waste landfilling rates in 32 European countries, 2001 and 2010
Chart (static)
Percentage of municipal waste landfilled in each European country, 2001 and 2010
Downloads
Data sources
Metadata
More info
Loading
- Municipal waste management in Austria
- Municipal waste by waste management operations (env_wasmun)
Methodology
The amounts of municipal waste reported as landfilled ('deposited onto or into land') have been divided by the amounts of municipal waste generated by country, and converted into percentages. Data for Austria has been corrected according to information received from the Austrian Umweltbundesamt.
Additional information
Notes: The further from the centre in the radar chart, the worse the waste management. Countries are ranked from the highest landfilling rate in 2010 to the lowest. The landfilling rate is calculated as a % of MSW landfilled per MSW generated. According to Eurostat the comparability of the data over time is high. However, some breaks in the time series are documented, which can influence the comparability between countries and within a country. Generally, the quality of the data seems to better in the end of the period between 2001 and 2010 than in the beginning.