All official European Union website addresses are in the europa.eu domain.
See all EU institutions and bodiesAn official website of the European Union | How do you know?
Environmental information systems
EN
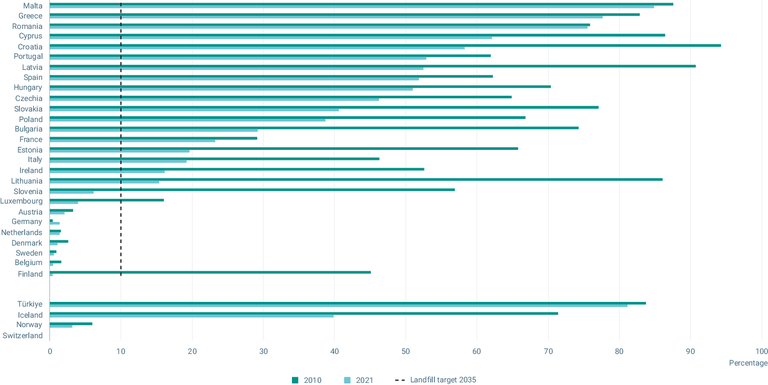
Cluster columns chart shows development in landfill rate of municipal waste in European countries in 2010 and 2021. Data is presented in descending order according to 2021 data values. Line chart represents EU landfill target for 2035.
Loading