All official European Union website addresses are in the europa.eu domain.
See all EU institutions and bodies
An official website of the European Union | How do you know?
Environmental information systems
EN

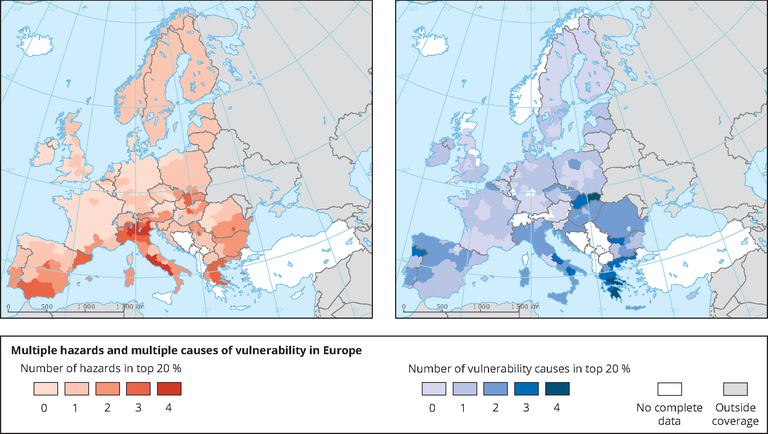
The map uses a colour gradient to show the number hazards (left) and number of vulnerability causes (right), for which the NUTS2 region is in the top 20% of exposure in Europe
Loading