All official European Union website addresses are in the europa.eu domain.
See all EU institutions and bodies
An official website of the European Union | How do you know?
Environmental information systems
EN

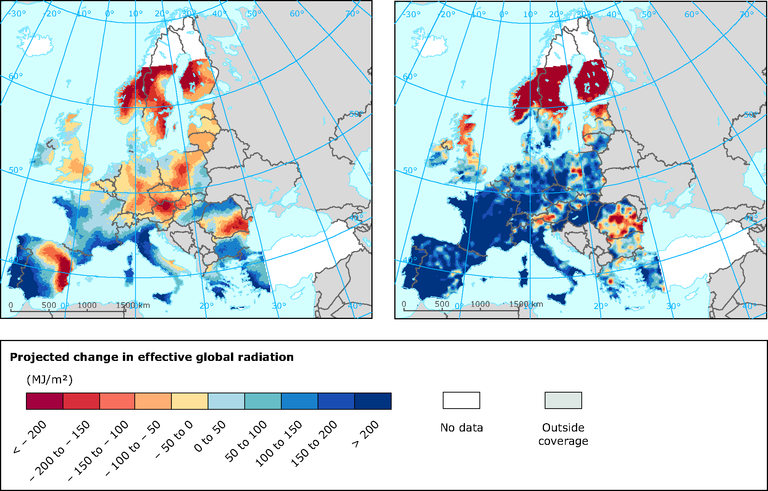
The map shows the mean changes in effective solar radiation (MJ m-2), which is an indicator for water-limited crop productivity, for the period 2031–2050 compared with 1975–1994 for the RACMO (KNMI) and HadRCM3 (Hadley Centre.HC) projections under the A1B emission scenario.
Loading