All official European Union website addresses are in the europa.eu domain.
See all EU institutions and bodiesAn official website of the European Union | How do you know?
Environmental information systems
EN
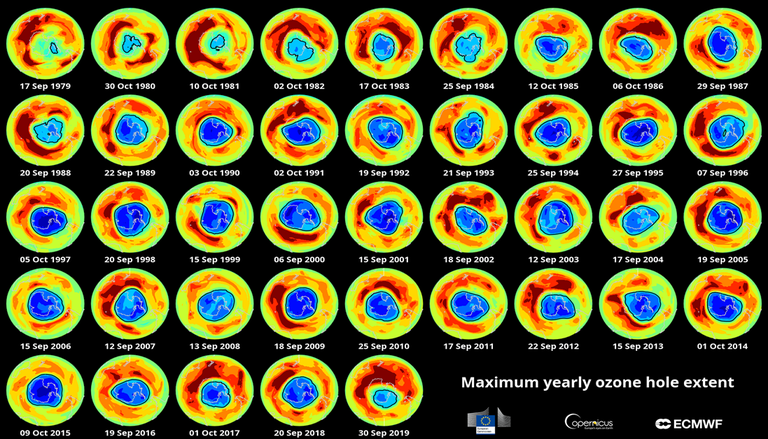
Copernicus analyses of total ozone column over the Antarctic. The blue colours indicate lowest ozone columns, while yellow and red indicate higher ozone columns. Ozone columns are commonly measured in Dobson Units. One Dobson Unit is the number of molecules of ozone that would be required to create a layer of pure ozone 0.01 millimetres thick at a temperature of 0 degrees Celsius and a pressure of 1 atmosphere. 300 DU corresponds to 3 millimetres of ozone.
Loading