All official European Union website addresses are in the europa.eu domain.
See all EU institutions and bodiesAn official website of the European Union | How do you know?
Environmental information systems
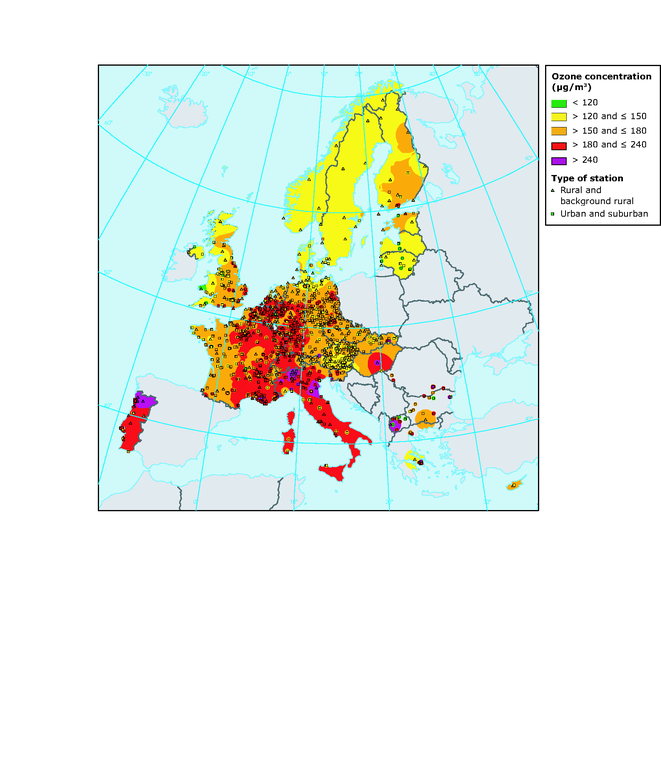
Maximum 1-hour concentrations observed during the summer period 2004 (April-September)
Map (static)

Downloads
Data sources
Metadata
More info
Loading
- Austria
- Belgium
- Bulgaria
- Cyprus
- Czechia
- Denmark
- Estonia
- Finland
- France
- Germany
- Greece
- Hungary
- Italy
- Latvia
- Liechtenstein
- Lithuania
- Malta
- Netherlands
- Norway
- Portugal
- Romania
- Slovakia
- Slovenia
- Sweden
- Switzerland
- United Kingdom
