All official European Union website addresses are in the europa.eu domain.
See all EU institutions and bodies
An official website of the European Union | How do you know?
Environmental information systems
EN

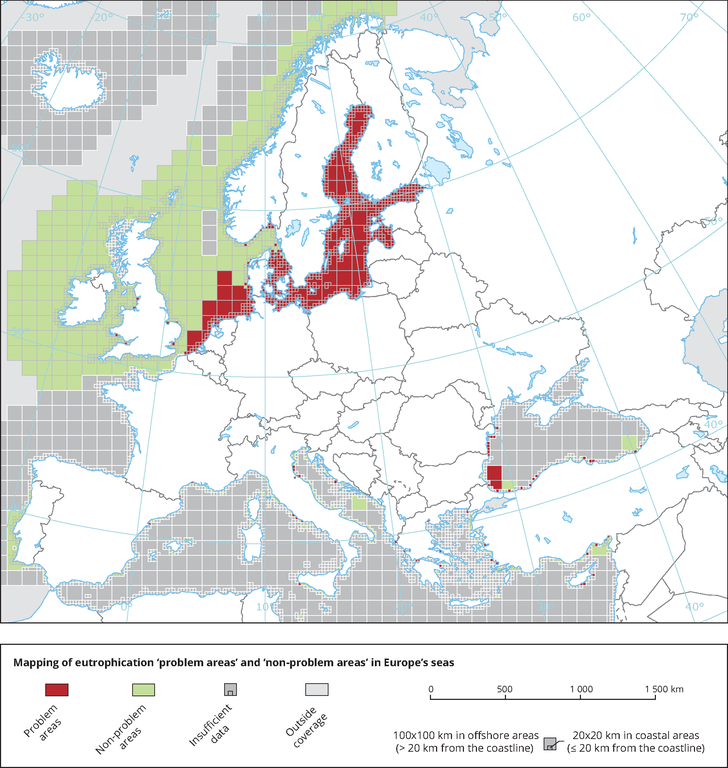
The map shows the results of classification of Eutrophication Status using the HEAT+ tool. Eutrophication status is classified as ‘non-problem areas’ or ‘problem areas’.
Loading