All official European Union website addresses are in the europa.eu domain.
See all EU institutions and bodies
An official website of the European Union | How do you know?
Environmental information systems
EN

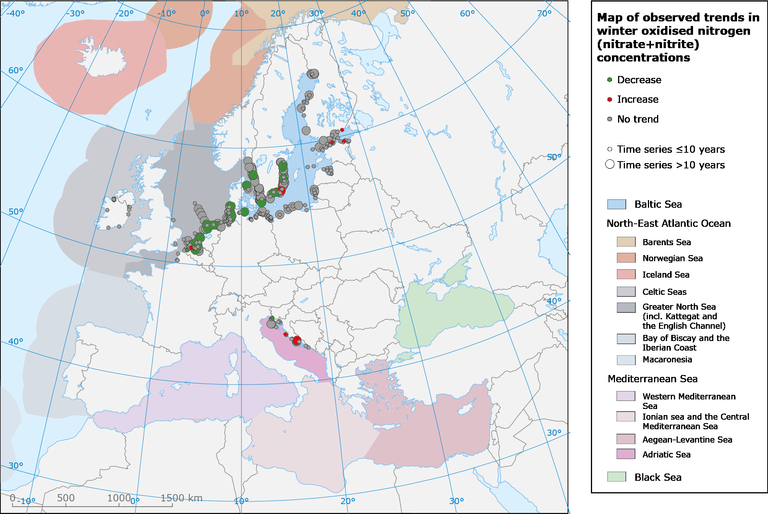
Stations showing a statistically significant decrease (green), increase (red) or no trend (grey) of winter oxidised nitrogen concentrations within the period 1985 to 2012. Selected stations must have data, at least, in the period 2007-2012 and must have at least five years data in all.
Loading