All official European Union website addresses are in the europa.eu domain.
See all EU institutions and bodiesAn official website of the European Union | How do you know?
Environmental information systems
EN
- БългарскиBG
- češtinaCS
- HrvatskiHR
- danskDA
- NederlandsNL
- ελληνικάEL
- EnglishEN
- eestiET
- SuomiFI
- FrançaisFR
- DeutschDE
- magyarHU
- ÍslenskaIS
- italianoIT
- LatviešuLV
- lietuviųLT
- MaltiMT
- NorskNO
- polskiPL
- PortuguêsPT
- RomânăRO
- slovenčinaSK
- SlovenščinaSL
- EspañolES
- SvenskaSV
- TürkçeTR
Long term trends in material productivity 1980 (1992) – 2008 (2007)
Chart (static)
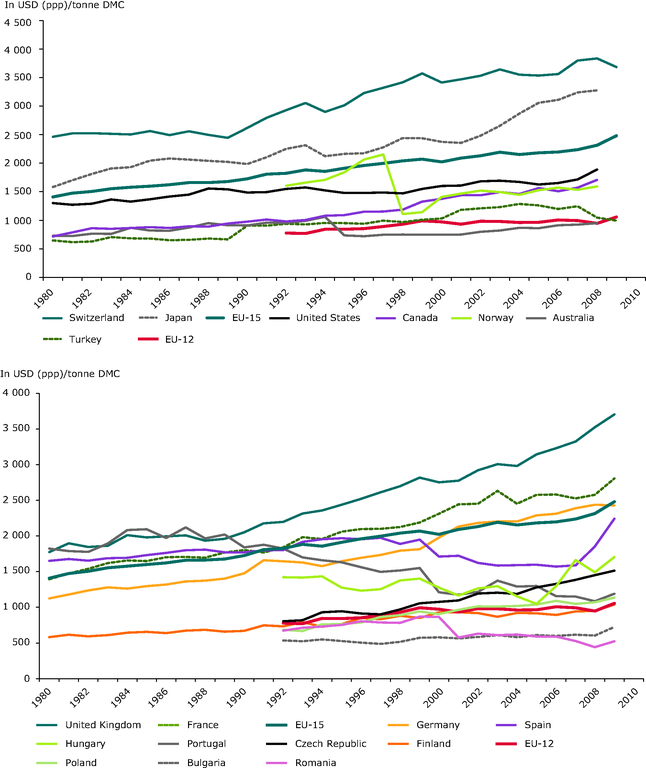
This figure shows the material productivity (GDP per tonnes DMC) for selected EU27 countries and selected other countries in 1980 (1992) and 2009 (2008).

Downloads
Data sources
Metadata
More info
Loading
- GDP in millions of 2011 US$
- Australia
- Norway
- Canada
- United States
- Japan
- Turkey
- Switzerland
- Romania
- Czechia
- Bulgaria
- Hungary
- Poland
- Greece
- Portugal
- Spain
- United Kingdom
- Netherlands
- Belgium
- Germany
- France
- Italy
- Finland
- Denmark
- Sweden
- Austria
- Luxembourg
- Ireland
1980-2009
Methodology
The methodology for the calculation of DMI / DMC was revised by Eurostat in 2007. For this figure, the data are calculated after the revised methodology from 2000 on. Therefore, the data set compromises the consistency in order to provide an extended temporal coverage.