All official European Union website addresses are in the europa.eu domain.
See all EU institutions and bodiesAn official website of the European Union | How do you know?
Environmental information systems
EN
- БългарскиBG
- češtinaCS
- HrvatskiHR
- danskDA
- NederlandsNL
- ελληνικάEL
- EnglishEN
- eestiET
- SuomiFI
- FrançaisFR
- DeutschDE
- magyarHU
- ÍslenskaIS
- italianoIT
- LatviešuLV
- lietuviųLT
- MaltiMT
- NorskNO
- polskiPL
- PortuguêsPT
- RomânăRO
- slovenčinaSK
- SlovenščinaSL
- EspañolES
- SvenskaSV
- TürkçeTR
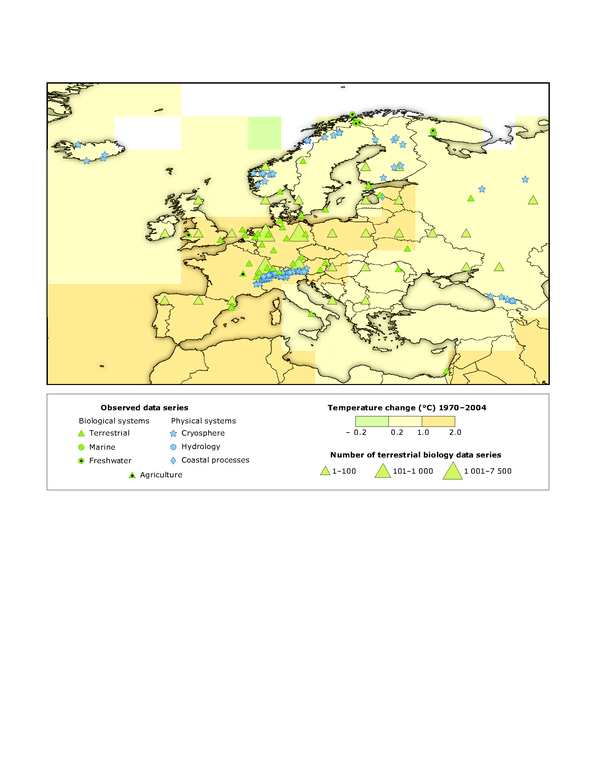
Locations of significant changes in data series of physical and biological systems, shown together with surface air temperature changes over the period 1970-2004
Map (static)
Based on HadCRUT3 data
Downloads
Data sources
Metadata
More info
Loading
A subset of about 29 000 data series was selected from about 80 000 data series from 577 studies. These met the following criteria: (1) ending in 1990 or later; (2) spanning a period of at least 20 years; and (3) showing a significant change in either direction, as assessed in individual studies. Note that 28 000 of the 29 000 data series are from European studies. White areas do not contain sufficient observational climate data to estimate a temperature trend. The 2 x 2 boxes show the total number of data series with significant changes (top row) and the percentage of those consistent with warming (bottom row) for (i) continental regions: North America (NAM), Latin America (LA), Europe (EUR), Africa (AFR), Asia (AS), Australia and New Zealand (ANZ), and Polar Regions (PR) and (ii) globalscale: Terrestrial (TER), Marine and Freshwater (MFW), and Global (GLO). The numbers of studies from the seven regional boxes do not add up to the global (GLO) totals because numbers from regions except Polar do not include the numbers related to Marine and Freshwater (MFW) systems. Locations of large area marine changes are not shown on the map.