All official European Union website addresses are in the europa.eu domain.
See all EU institutions and bodiesAn official website of the European Union | How do you know?
Environmental information systems
EN
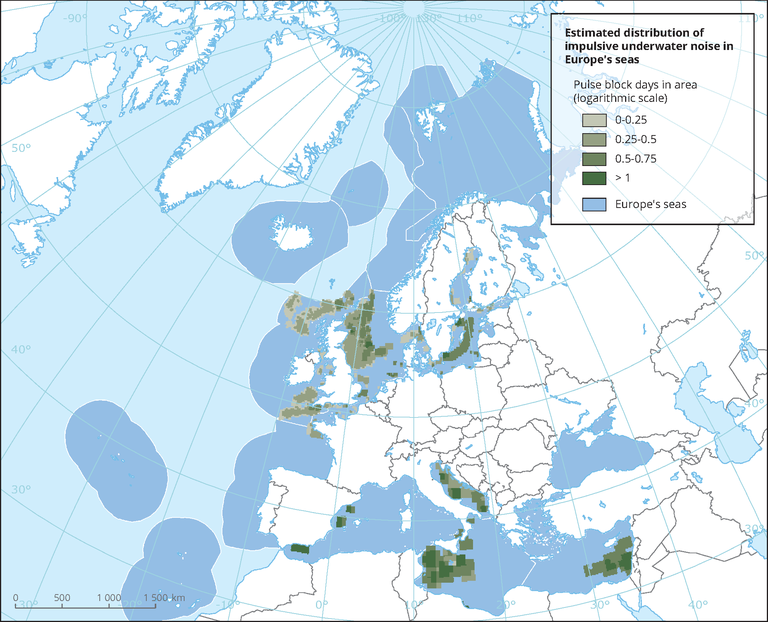
Input of impulsive anthropogenic sound was created by combining pulse-block-days (PBD) data from the ICES Registry (for HELCOM and OSPAR areas) and ACCOMBAS (for the Mediterranean Sea).
Loading