All official European Union website addresses are in the europa.eu domain.
See all EU institutions and bodies
An official website of the European Union | How do you know?
Environmental information systems
EN

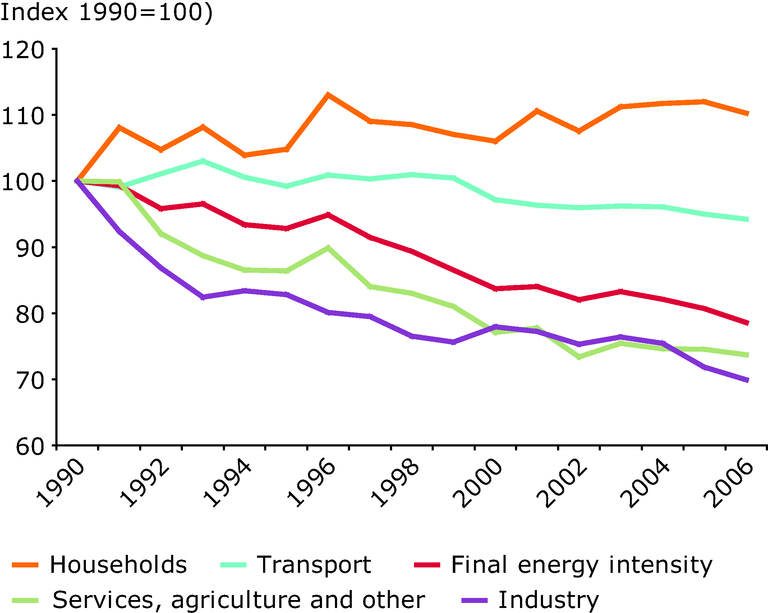
Final energy intensities between sectors, and also the total final energy intensity, are not comparable, because the normalising variables are not the same
Loading