All official European Union website addresses are in the europa.eu domain.
See all EU institutions and bodiesAn official website of the European Union | How do you know?
Environmental information systems
EN
- БългарскиBG
- češtinaCS
- HrvatskiHR
- danskDA
- NederlandsNL
- ελληνικάEL
- EnglishEN
- eestiET
- SuomiFI
- FrançaisFR
- DeutschDE
- magyarHU
- ÍslenskaIS
- italianoIT
- LatviešuLV
- lietuviųLT
- MaltiMT
- NorskNO
- polskiPL
- PortuguêsPT
- RomânăRO
- slovenčinaSK
- SlovenščinaSL
- EspañolES
- SvenskaSV
- TürkçeTR
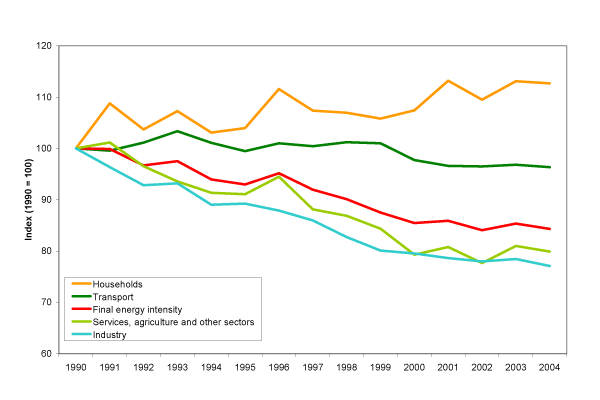
Index of final energy intensity and energy intensity by sector, EU-25
Chart (static)
Downloads
Data sources
Metadata
More info
Loading
Final energy intensities between sectors, and also the total final energy intensity, are not comparable, because the normalising variables are not the same. The indicator serves to highlight the evolution in energy intensity within each sector. The denominators for the total, household, transport, industry (excl. construction) and services (incl. agriculture) sector energy intensities are, respectively; GDP, population, GDP, Gross Value added in industry (excl. construction), and Gross Value Added in Services (incl. agriculture).