All official European Union website addresses are in the europa.eu domain.
See all EU institutions and bodiesAn official website of the European Union | How do you know?
Environmental information systems
EN
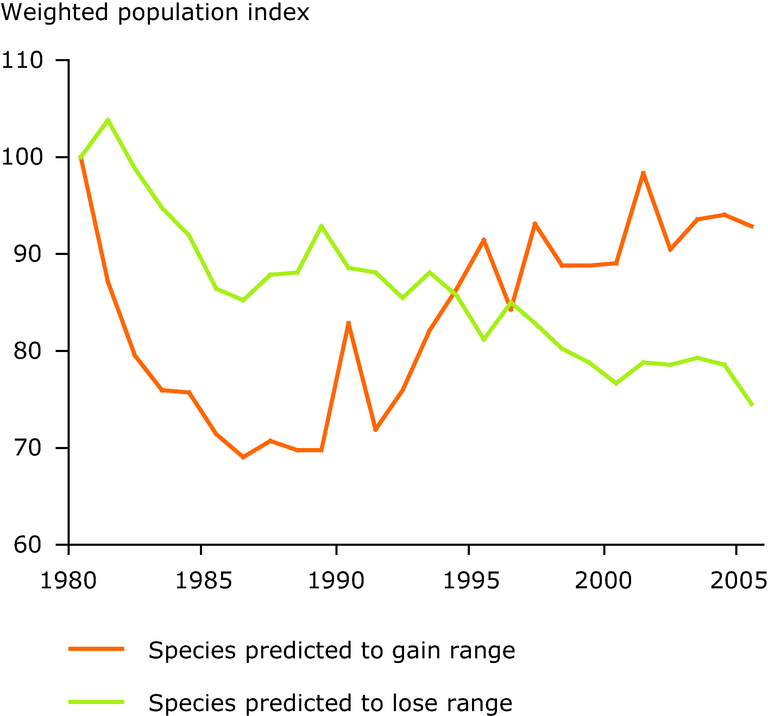
Weighted composite population trends under climate change were modelled as an index for two groups of widespread European land birds for 1980 to 2005, using climate envelope models
Loading