All official European Union website addresses are in the europa.eu domain.
See all EU institutions and bodies
An official website of the European Union | How do you know?
Environmental information systems
EN

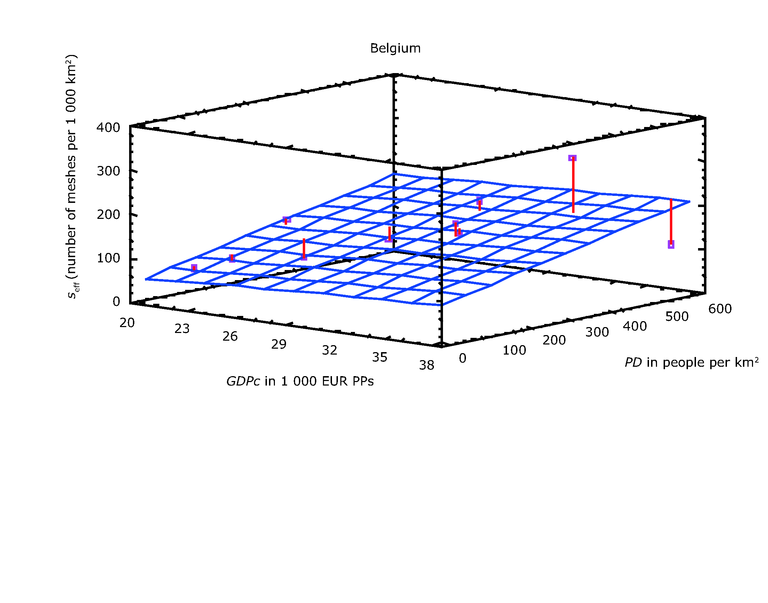
This simple example uses the data of the NUTS-X regions from Belgium (FG-B2). The effective mesh density (seff) is shown
as the response variable as a function of two predictor variables: population density (PD, between 64 and 600 people
per km2) and gross domestic product per capita (GDPc, between 20 500 and 37 000 euros PPs). The gridded plane shows
the predicted values for the effective mesh density for each combination of PD and GDPc. The differences between the
observed values of seff (shown as small squares) and the predicted values are shown as perpendicular lines and are called
residuals. In this example, the predicted level of fragmentation increases with higher population densities and with higher
gross domestic product per capita, and the variation in population density has a higher influence than the variation in GDPc.
Loading