All official European Union website addresses are in the europa.eu domain.
See all EU institutions and bodiesAn official website of the European Union | How do you know?
Environmental information systems
EN
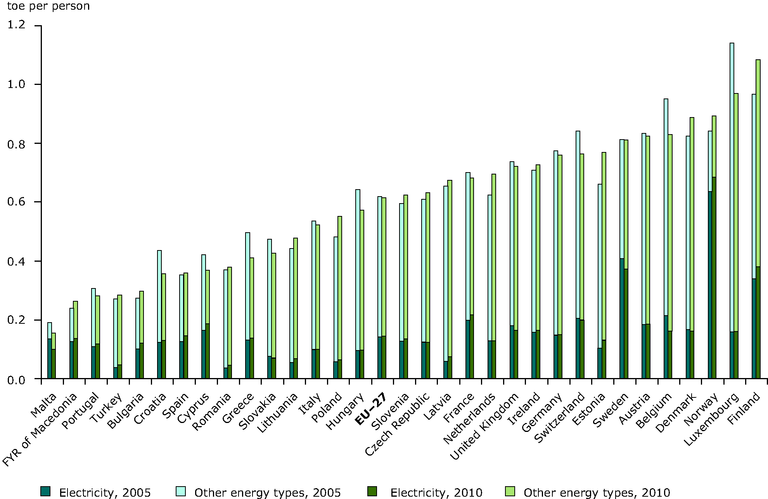
The graph shows the average per capita final energy consumption of households in 2005 and 2010, divided into electricity consumption and other energy types
Loading