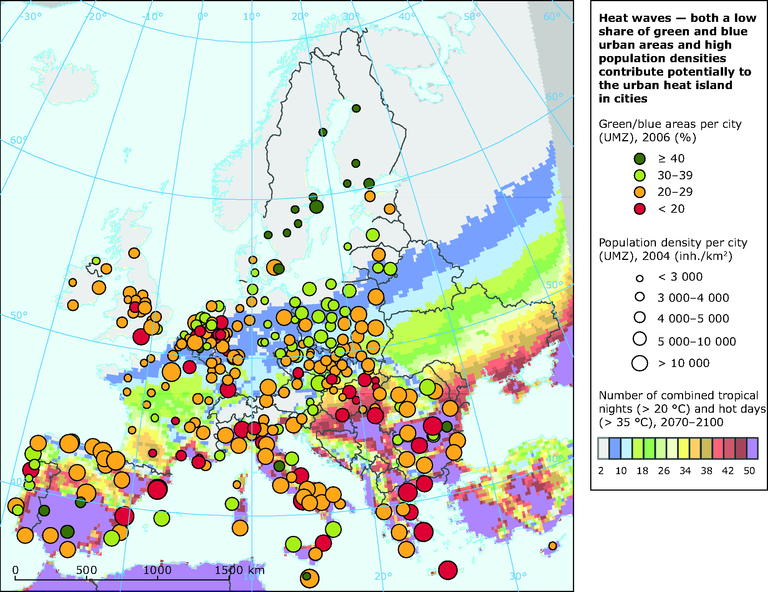
Heat waves — both a low share of green and blue urban areas and high population densities can contribute to the urban heat island effect in cities
Map (static)
The cities are displayed as dots of different colours and sizes. The colours represent the share of green and blue urban areas inside the Urban Morphological Zone of the city, the size of the dots reflects the population density within the core cities’ UMZ. The background map is the result of climatic modelling and represents the number of combined tropical nights (T>20°C) and hot days (T>35°C) for the period 2071 to 2100.
Green (vegetated) and blue (water) urban areas have been extracted from the Urban Atlas product, i.e. values for 369 core cities are available. The considered area is the UMZ inside the core city area (defined in Urban Atlas). The selection of classes contained in the green and blue urban areas is based on their relevance for the Urban Heat Island effect. The following selection has been made, all classes marked in green are components of the green and blue urban areas:
CODE
Urban Atlas classes
11230
Discontinuous Low Density Urban Fabric (S.L. : 10% - 30%)
11240
Discontinuous Very Low Density Urban Fabric (S.L. < 10%)
14100
Green urban areas
14200
Sports and leisure facilities
20000
Agricultural areas, semi-natural areas and wetlands
30000
Forests
50000
Water bodies
Those classes were extracted from the Urban Atlas, their area summed up and its share in relation to the total area of the city (core city-UMZ) calculated. For the map production the values were classified into 4 classes and presented as coloured dots on the map.
The population statistics (total population) have been exported from the Urban Audit database for the reference year 2004 (IE and BG data are from 2001), reprocessed to reflect core city-UMZ related population densities and mapped as dots of different sizes.