Figure
Gross value added of water consumed in irrigated agriculture in Spain, 2001–2002
Metadata
Additional information
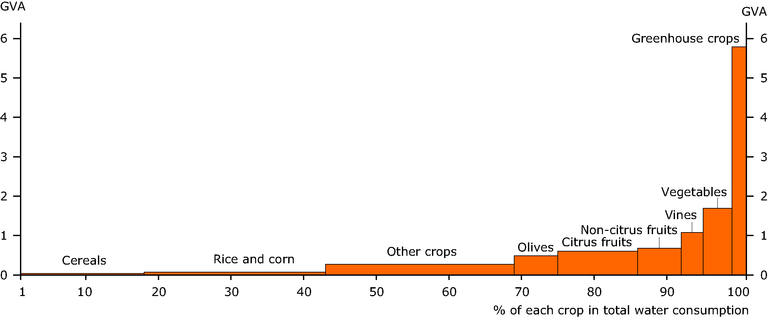
The y-axis measures GVA (euro) per m3 of water consumed. Each rectangle area is proportional to the share of each crop in the value added of irrigated agriculture
Permalinks
- Permalink to this version
- 2380df07-6700-4fc0-b961-b79c603a0660
- Permalink to latest version
- H6K8WI5MFS
Geographic coverage
Temporal coverage
For references, please go to https://www.eea.europa.eu/data-and-maps/figures/gross-value-added-of-water or scan the QR code.
PDF generated on 23 May 2022, 10:41 AM
Document Actions
Share with others