All official European Union website addresses are in the europa.eu domain.
See all EU institutions and bodies
An official website of the European Union | How do you know?
Environmental information systems
EN

- БългарскиBG
- češtinaCS
- HrvatskiHR
- danskDA
- NederlandsNL
- ελληνικάEL
- EnglishEN
- eestiET
- SuomiFI
- FrançaisFR
- DeutschDE
- magyarHU
- ÍslenskaIS
- italianoIT
- LatviešuLV
- lietuviųLT
- MaltiMT
- NorskNO
- polskiPL
- PortuguêsPT
- RomânăRO
- slovenčinaSK
- SlovenščinaSL
- EspañolES
- SvenskaSV
- TürkçeTR
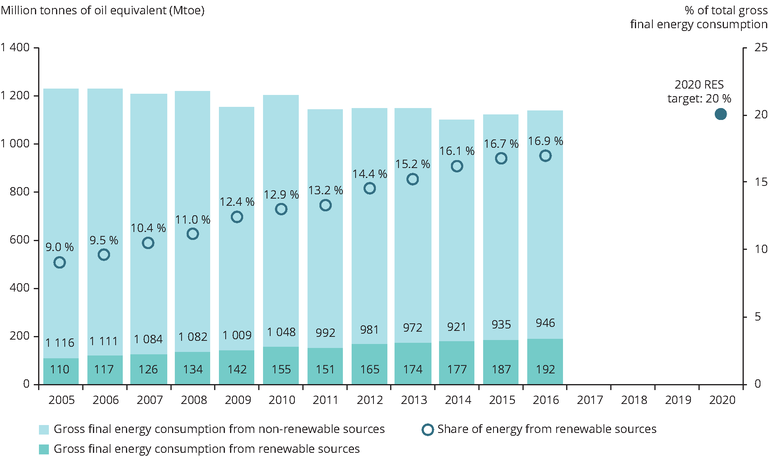
Gross final energy consumption of renewable and non-renewable energy sources, 2005-2015 and approximated RES share 2016
Map (static)
The bar charts represent the gross final renewable (green) and non-renewable (grey) energy consumption of the EU-28. The white dots show the renewable energy share of the EU-28 compared to the target in 2020.
Downloads
Data sources
Metadata
More info
Loading
- Final energy consumption (t2020_34)
- Share of renewable energy in cross final energy consumption
- Austria
- Belgium
- Bulgaria
- Croatia
- Cyprus
- Czechia
- Denmark
- Estonia
- Finland
- France
- Germany
- Greece
- Hungary
- Ireland
- Italy
- Latvia
- Lithuania
- Luxembourg
- Malta
- Netherlands
- Poland
- Portugal
- Romania
- Slovakia
- Slovenia
- Spain
- Sweden
- United Kingdom
2005-2020
Methodology
Based on:
• Renewable energy data from Eurostat, reported by MS under the Energy Statistics Regulation (EC) No 1099/2008 and the Renewable Energy Directive (2009/28/EC) and published in the SHARES - Short Assessment of Renewable Energy Sources tool.
• 2016 approximated estimates for renewable energy use estimated by EEA.
Targets and trajectories based on:
• Part A and B of Annex 1 of Directive 2009/28/EC of the European Parliament and of the Council of 23 April 2009 on the promotion of the use of energy from renewable sources and amending and subsequently repealing Directives 2001/77/EC and 2003/30/EC.
Additional information
Eurostat, 2016 calculates RES consumption and as part of this process normalises wind and hydro electricity generation, which is part of the RES share numerator. However, the total consumption of electricity included in the denominator is not normalised. In the figure above, non-normalised gross final energy consumption is displayed together with RES shares in which the numerator has been normalised.
!!! OBS !!! SOURCE INFORMATION WILL BE UPDATED NOV-2017 - Approximated share of energy from renewable sources
This figure is related to the following document: https://www.eea.europa.eu/policy-documents/2009-28-ec