All official European Union website addresses are in the europa.eu domain.
See all EU institutions and bodiesAn official website of the European Union | How do you know?
Environmental information systems
EN
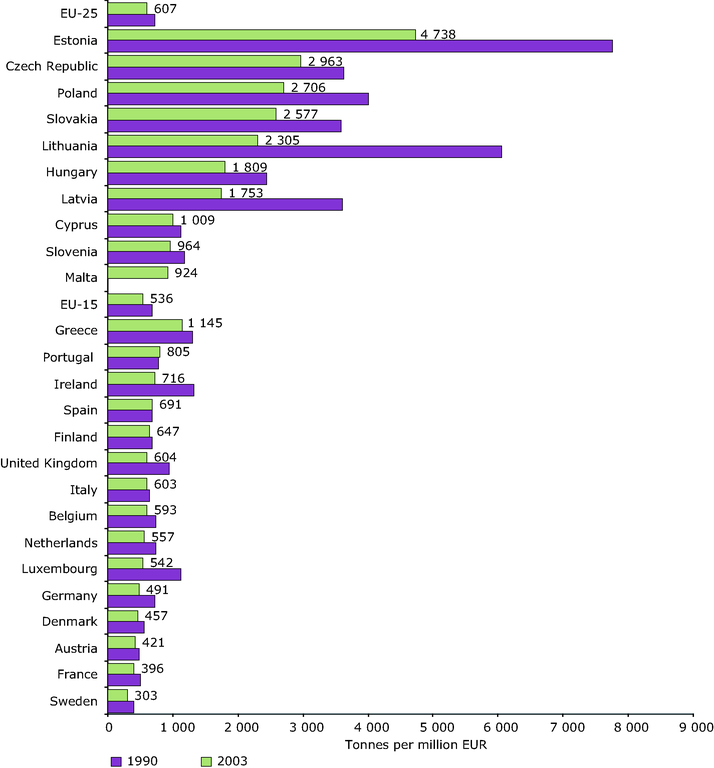
Due to lack of data, 1990 values refer to 1995 for the Czech Republic, Estonia, Hungary, Poland, Slovakia, and EU-25.
Loading