All official European Union website addresses are in the europa.eu domain.
See all EU institutions and bodiesAn official website of the European Union | How do you know?
Environmental information systems
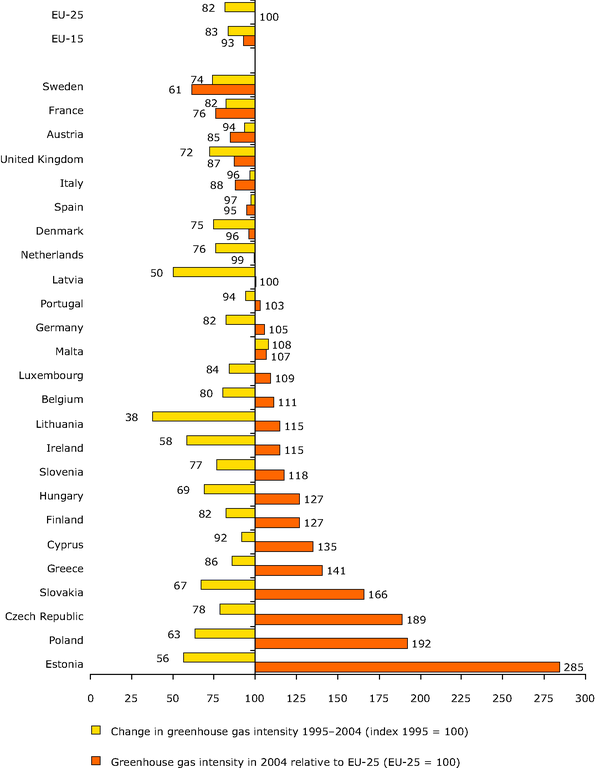
Greenhouse gas emissions per GDP of EU-25 Member States: comparison with EU-25 average in 2004 and change since 1995 (index 1995=100)
Chart (static)

Downloads
Data sources
Metadata
More info
Loading
- Austria
- Belgium
- Cyprus
- Czechia
- Denmark
- Estonia
- Finland
- France
- Germany
- Greece
- Hungary
- Ireland
- Italy
- Latvia
- Lithuania
- Luxembourg
- Malta
- Netherlands
- Poland
- Portugal
- Slovakia
- Slovenia
- Spain
- Sweden
- United Kingdom
