All official European Union website addresses are in the europa.eu domain.
See all EU institutions and bodiesAn official website of the European Union | How do you know?
Environmental information systems
EN
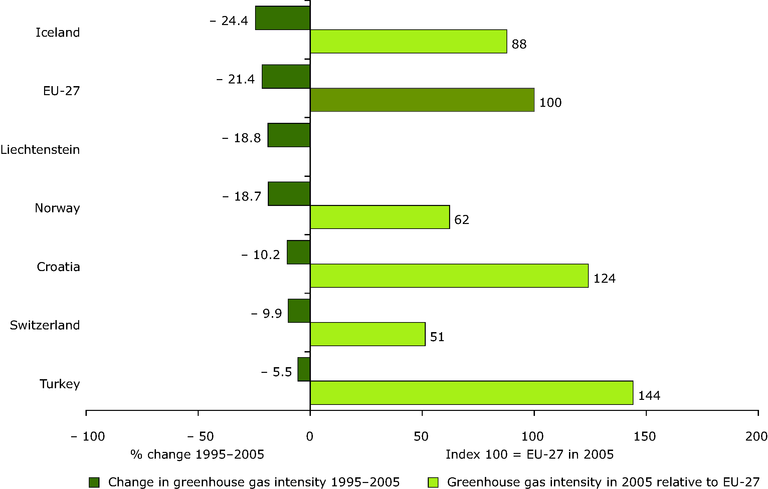
The analysis of the change in greenhouse gas intensity was based on GDP data at constant prices (1995 level)
Loading