All official European Union website addresses are in the europa.eu domain.
See all EU institutions and bodiesAn official website of the European Union | How do you know?
Environmental information systems
EN
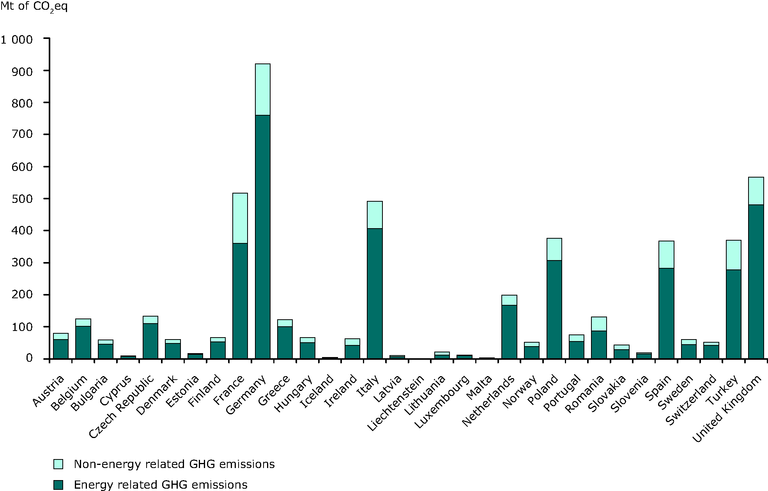
Greenhouse gas emissions (Kyoto gases) per country split between combustion and non-combustion emissions, 2009
Loading