All official European Union website addresses are in the europa.eu domain.
See all EU institutions and bodiesAn official website of the European Union | How do you know?
Environmental information systems
EN
- БългарскиBG
- češtinaCS
- HrvatskiHR
- danskDA
- NederlandsNL
- ελληνικάEL
- EnglishEN
- eestiET
- SuomiFI
- FrançaisFR
- DeutschDE
- magyarHU
- ÍslenskaIS
- italianoIT
- LatviešuLV
- lietuviųLT
- MaltiMT
- NorskNO
- polskiPL
- PortuguêsPT
- RomânăRO
- slovenčinaSK
- SlovenščinaSL
- EspañolES
- SvenskaSV
- TürkçeTR
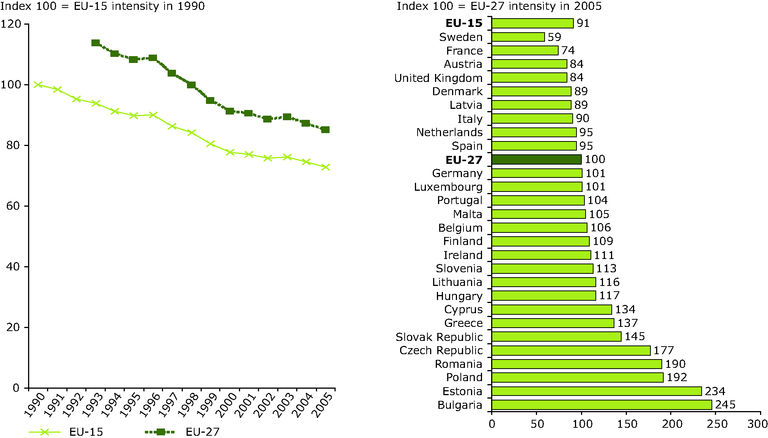
Greenhouse gas emissions intensity per GDP for EU-15 and EU-27 and their Member States
Chart (static)
The chart on the left shows the change in the economic intensity of greenhouse gases (i.e
Downloads
Data sources
Metadata
More info
Loading
greenhouse gases divided by GDP) between 1990 and 2005. GDP is measured in constant prices. It is expressed as an index where the intensity in 1990 for the EU15 equals 100. The EU27 intensity is relative to the EU15 and starts in 1993 because of missing data for a few Member States. A trend line below 100 indicates there has been a relative decoupling of greenhouse gases from economic growth. The chart on the right shows the greenhouse gas economic intensity (i.e. greenhouse gases divided by GDP) for each country in 2005 relative to the EU27 (index = 100). GDP here is measured in purchasing power standards. These are currency conversion rates that both convert to a common currency and equalise the purchasing power of different currencies. They eliminate the differences in price levels between countries, allowing meaningful volume comparisons of GDP. They are a suitable unit for benchmarking country performance in a particular year.