All official European Union website addresses are in the europa.eu domain.
See all EU institutions and bodiesAn official website of the European Union | How do you know?
Environmental information systems
EN
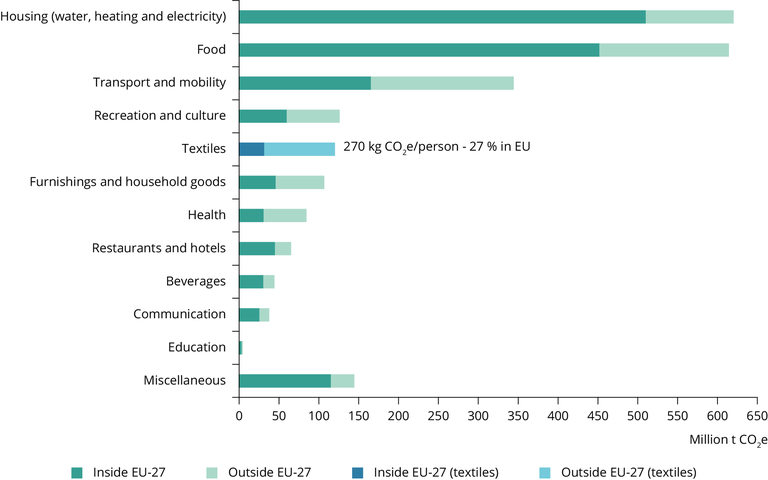
To produce and handle all clothing, footwear and household textiles purchased by EU-27 households in 2020, an estimated 121 million tonnes of CO₂ were emitted (270 kg CO₂ equivalent per person), making this consumption domain the fifth highest impact category after housing, food, transport and recreation. Only 27% of CO₂ emissions take place within Europe.
Loading