next
previous
items

Figure

Greenhouse gas emissions by sector in 2003, EU-25, EU-15 and EU-10

Figure Created 12 Nov 2009 Published 12 Nov 2009 Last modified 29 Nov 2012
1 min read
Topics:
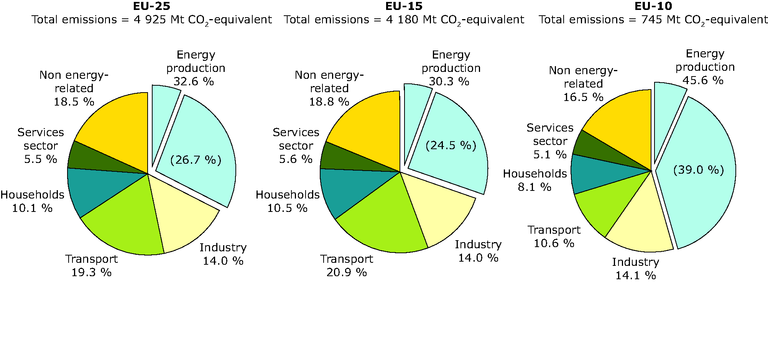
The numbers in parentheses indicate the share of emissions from public heat and electricity production, which form the major part of emissions from energy production

Download

Metadata

Additional information

Annual emissions of CO2, CH4, N2O, HFC, PFC and SF6 in the UNFCCC reporting format are converted to their global warming potential GWP (100 year time horizon) for addition and comparison with the Kyoto Protocol targets: 1 t CH4 = 21 t CO2-equivalent, 1 t N2O = 310 t CO2-equivalent, 1 t SF6 = 23 900 t CO2-equivalent. HFCs and PFCs have a wide range of GWPs depending on the gas and emissions are already reported in tonnes CO2-equivalent.

Permalinks

Geographic coverage

Topics

Topics:

Tags

Document Actions