All official European Union website addresses are in the europa.eu domain.
See all EU institutions and bodiesDo something for our planet, print this page only if needed. Even a small action can make an enormous difference when millions of people do it!
Figure
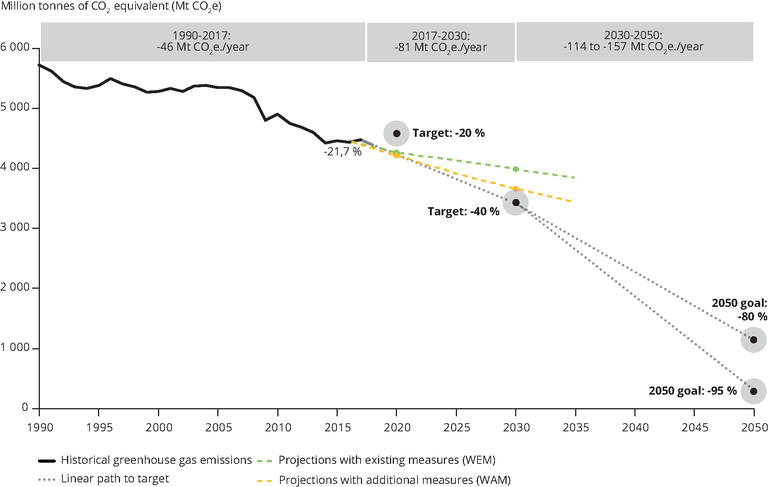
The GHG emission trends, projections and targets include emissions from international aviation, and exclude emissions and removals from the land-use sector. The WEM scenario reflects existing policies and measures, while the WAM scenario takes into account the additional effects of planned measures reported by Member States. For the most part, these projections were reported in 2017 and therefore do not reflect the expected effects of recent policy adopted for the period after 2020.
Historic trends from 1990 to 2016 are represented in solid lines.The 2016–2017 trend is approximated (preliminary estimates). Projections until 2035 are represented in dashed lines.The upper line represents the scenario "with existing measures" (WEM), while the lower line represents the scenario "with additional measures" (WAM). EU targets and objectives for 2020, 2030 and 2050 are represented as bullets.
For references, please go to https://www.eea.europa.eu/data-and-maps/figures/greenhouse-gas-emission-trend-projections or scan the QR code.
PDF generated on 10 Sep 2024, 12:50 PM
Engineered by: EEA Web Team
Software updated on 26 September 2023 08:13 from version 23.8.18
Software version: EEA Plone KGS 23.9.14
Document Actions
Share with others