All official European Union website addresses are in the europa.eu domain.
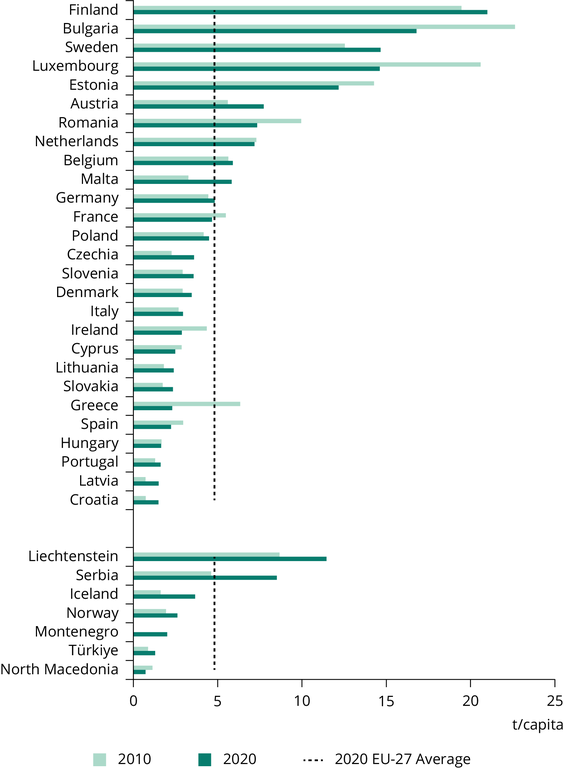
See all EU institutions and bodiesGeneration of waste per capita and by European country (2010 and 2020)
Chart (static)
The figure shows waste generation per capita by European countries. Data presented in form of bar chart are displayed as a comparison of the reference (2010) and last available year.

- Generation of waste by waste category, hazardousness and NACE Rev. 2 activity (env_wasgen)
- Albania
- Austria
- Belgium
- Bosnia and Herzegovina
- Bulgaria
- Croatia
- Cyprus
- Czechia
- Denmark
- Estonia
- Finland
- France
- Germany
- Greece
- Hungary
- Iceland
- Ireland
- Italy
- Kosovo
- Latvia
- Liechtenstein
- Lithuania
- Luxembourg
- Malta
- Montenegro
- Netherlands
- North Macedonia
- Norway
- Poland
- Portugal
- Romania
- Serbia
- Slovakia
- Slovenia
- Spain
- Sweden
- Switzerland
- Turkey
Methodology
Data for waste generation, excluding major mineral wastes, was retrieved from Eurostat. Data are displayed on country level, contain all NACE activities and households and are expressed in kg per capita. Frequency of data publishing is every two years.
Geographical coverage is EU-27 countries and other European countries where data are available, which are either members of the EEA or have a cooperation agreement. Data are not available for both 2010 and 2020 for Albania, Bosnia and Herzegovina, Kosovo (under United Nations Security Council Resolution 1244/99) and Switzerland. 2010 data are not available for Montenegro. For Iceland, Ireland and Liechtenstein, 2018 data were used also for 2020.
