All official European Union website addresses are in the europa.eu domain.
See all EU institutions and bodiesAn official website of the European Union | How do you know?
Environmental information systems
EN
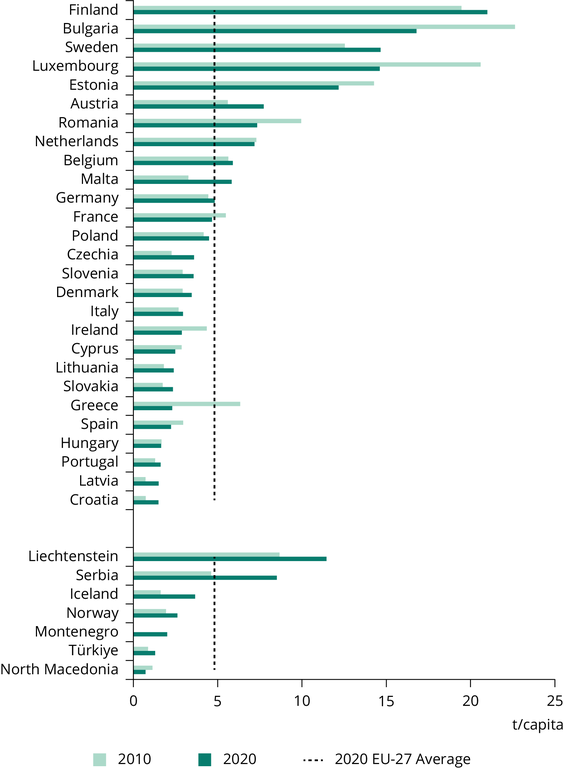
The figure shows waste generation per capita by European countries. Data presented in form of bar chart are displayed as a comparison of the reference (2010) and last available year.
Loading