All official European Union website addresses are in the europa.eu domain.
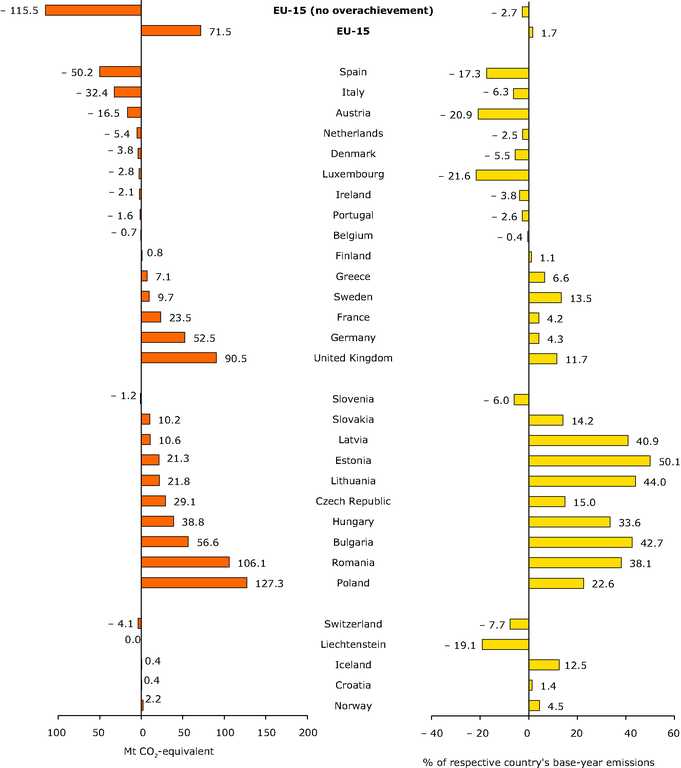
See all EU institutions and bodiesA positive value indicates that average 2008-to-2011 emissions in the non‑ETS sectors were lower than the average annual target, taking into account the effect of allowances attributed to the EU ETS and without use of carbon sinks and Kyoto mechanisms.
Loading


