Figure
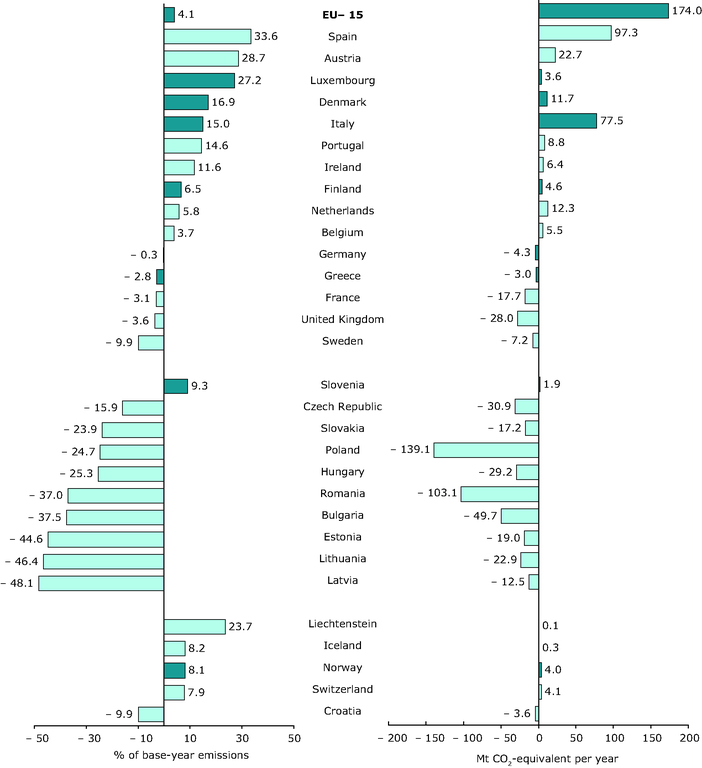
Gap between average annual emissions in 2003–2007 (or 2004–2008) and initial assigned amounts in Europe
Additional information
A negative value indicates that the country for which 2003–2007 or 2004–2008 average emissions are already below its 2008–2012 target.
The dark blue bars indicate Member States for which the 2004–2008 average was used, based on these countries' estimates of 2008 emissions. The same applies to the EU‑15 values.
Countries are sorted by regional grouping (EU‑15, EU‑12, non‑EU countries) and ranked by increasing gap (in absolute figures) between their total GHG emissions and their Kyoto target (assigned amount units), without use of carbon sinks and Kyoto mechanisms.
Permalinks
- Permalink to this version
- bc7c6a7792a30b04342d42221e5178db
- Permalink to latest version
- 5QZPQT3Z6R
Geographic coverage
Temporal coverage
For references, please go to https://www.eea.europa.eu/data-and-maps/figures/gap-between-average-annual-emissions-in-200320132007-or-200420132008-and-initial-assigned-amounts-in-europe or scan the QR code.
PDF generated on 02 Mar 2021, 06:47 AM
Document Actions
Share with others