All official European Union website addresses are in the europa.eu domain.
See all EU institutions and bodies
An official website of the European Union | How do you know?
Environmental information systems
EN

- БългарскиBG
- češtinaCS
- HrvatskiHR
- danskDA
- NederlandsNL
- ελληνικάEL
- EnglishEN
- eestiET
- SuomiFI
- FrançaisFR
- DeutschDE
- magyarHU
- ÍslenskaIS
- italianoIT
- LatviešuLV
- lietuviųLT
- MaltiMT
- NorskNO
- polskiPL
- PortuguêsPT
- RomânăRO
- slovenčinaSK
- SlovenščinaSL
- EspañolES
- SvenskaSV
- TürkçeTR
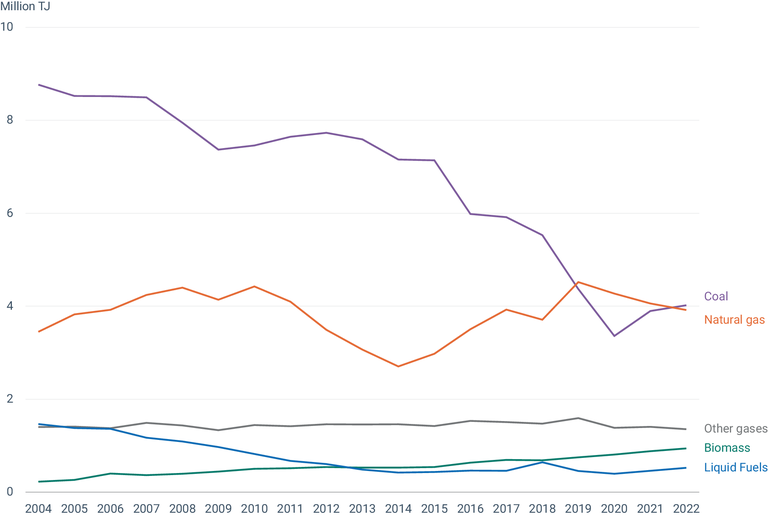
Fuel consumption in the EU-27, per fuel type
Chart (static)
The figure shows the fuel consumption trends from Large Combustion Plants (LCP) in the EU-27.
Downloads
Data sources
Metadata
More info
Loading
- Industrial Reporting under the Industrial Emissions Directive 2010/75/EU and European Pollutant Release and Transfer Register Regulation (EC) No 166/2006 - ver. 10.0 Dec 2023 (Tabular data)
- Austria
- Belgium
- Bulgaria
- Croatia
- Cyprus
- Czechia
- Denmark
- Estonia
- Finland
- France
- Germany
- Greece
- Hungary
- Ireland
- Italy
- Latvia
- Lithuania
- Luxembourg
- Malta
- Netherlands
- Poland
- Portugal
- Romania
- Slovakia
- Slovenia
- Spain
- Sweden
2004-2022
Methodology
Data on large combustion plants covered by the Large Combustion Plants Directive (until 2015) and the Industrial Emissions Directive (as from 2016). The data was processed to remove outliers and gap-fill missing data.
Additional information
Data for some Member States has been gap-filled as follow due to lack in reporting:
Czechia: 2020 values used to gap fill 2021-2022
Malta: 2019 values used to gap fill 2020-2022
Slovakia: 2018 values used to gap fill 2019-2022
Bulgaria: 2021 used to gap fill 2022 due to late reporting