All official European Union website addresses are in the europa.eu domain.
See all EU institutions and bodiesAn official website of the European Union | How do you know?
Environmental information systems
EN
- БългарскиBG
- češtinaCS
- HrvatskiHR
- danskDA
- NederlandsNL
- ελληνικάEL
- EnglishEN
- eestiET
- SuomiFI
- FrançaisFR
- DeutschDE
- magyarHU
- ÍslenskaIS
- italianoIT
- LatviešuLV
- lietuviųLT
- MaltiMT
- NorskNO
- polskiPL
- PortuguêsPT
- RomânăRO
- slovenčinaSK
- SlovenščinaSL
- EspañolES
- SvenskaSV
- TürkçeTR
Freight transport volumes and GDP
Chart (static)
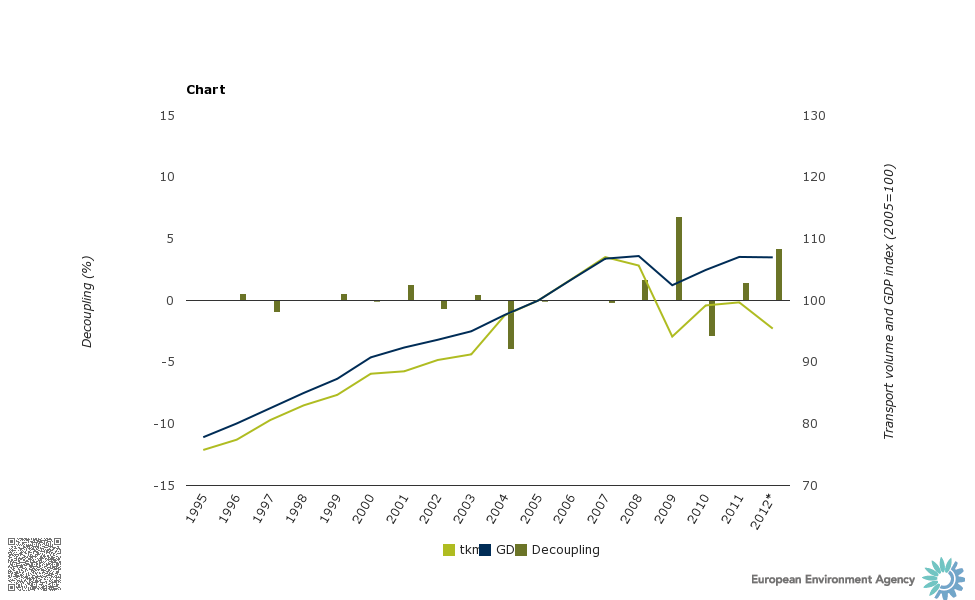
The two lines in the main graph show the development in real GDP and freight transport volumes in the EEA-33 (excluding Croatia and Liechtenstein), while the columns show the level of annual decoupling. A positive value on the columns indicates higher growth in GDP than in freight transport (i.e. decoupling), while a negative value indicates higher growth in freighttransport than in GDP. The data refer to road, rail and inland waterways modes of transport.
Notes:
- GDP: Gross Domestic Product.
- tkm: billion tonne kilometre.
- *Estimation for 2012: it is calculated using the estimated 2012 energy consumption data from TERM 01 multiplied by the 2011 ratio of transport demand to fuel consumption. In the case of road and rail, the latest 2012 freight data available from Eurostat has been used.
- Transport volume (road, rail and inland waterways) and GDP index (2005=100).
Downloads
Data sources
Metadata
More info
- Volume of freight transport, Statistical Office of the European Union (Eurostat)
- Austria
- Belgium
- Bulgaria
- Cyprus
- Czechia
- Denmark
- Estonia
- Finland
- France
- Germany
- Greece
- Hungary
- Iceland
- Ireland
- Italy
- Latvia
- Lithuania
- Luxembourg
- Malta
- Netherlands
- Norway
- Poland
- Portugal
- Romania
- Slovakia
- Slovenia
- Spain
- Sweden
- Switzerland
- United Kingdom