All official European Union website addresses are in the europa.eu domain.
See all EU institutions and bodies
- БългарскиBG
- češtinaCS
- HrvatskiHR
- danskDA
- NederlandsNL
- ελληνικάEL
- EnglishEN
- eestiET
- SuomiFI
- FrançaisFR
- DeutschDE
- magyarHU
- ÍslenskaIS
- italianoIT
- LatviešuLV
- lietuviųLT
- MaltiMT
- NorskNO
- polskiPL
- PortuguêsPT
- RomânăRO
- slovenčinaSK
- SlovenščinaSL
- EspañolES
- SvenskaSV
- TürkçeTR
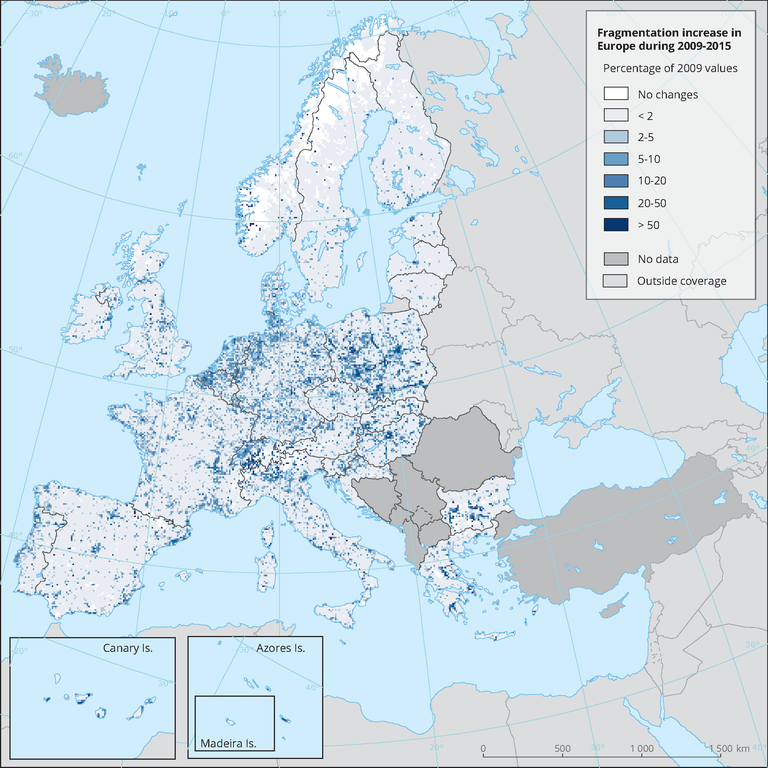
Fragmentation increase in Europe during 2009-2015
Map (static)
The map shows the difference of the years 2015 and 2009 and presents the increase in fragmentation in that period. The original 100m values were resampled to a 5 km grid for visualisation purposes.

- Albania
- Austria
- Belgium
- Bosnia and Herzegovina
- Bulgaria
- Croatia
- Cyprus
- Czechia
- Denmark
- Estonia
- Finland
- France
- Germany
- Greece
- Hungary
- Iceland
- Ireland
- Italy
- Kosovo
- Latvia
- Liechtenstein
- Lithuania
- Luxembourg
- Malta
- Montenegro
- Netherlands
- North Macedonia
- Norway
- Poland
- Portugal
- Romania
- Serbia
- Slovakia
- Slovenia
- Spain
- Sweden
- Switzerland
- Turkey
- United Kingdom
Methodology
Fragmentation as a result of urban and transport infrastructure expansion is monitored using the Copernicus Imperviousness and the TeleAtlas road network datasets.
Additional information
The map presents fragmentation increase after outliers have been removed (less than 5 percentile and more than 90 percentile). Fragmentation was calculated for the years 2009, 2012 and 2015 using the effective mesh size method.
The map covers the EEA-39 member countries. Due to poor data coverage of fragmentation geometries for this period the following countries have been omitted: Cyprus, Iceland, Albania, Kosovo, Serbia, Cyprus, North Macedonia, Romania, Bosnia and Herzegovina and Turkey.
