All official European Union website addresses are in the europa.eu domain.
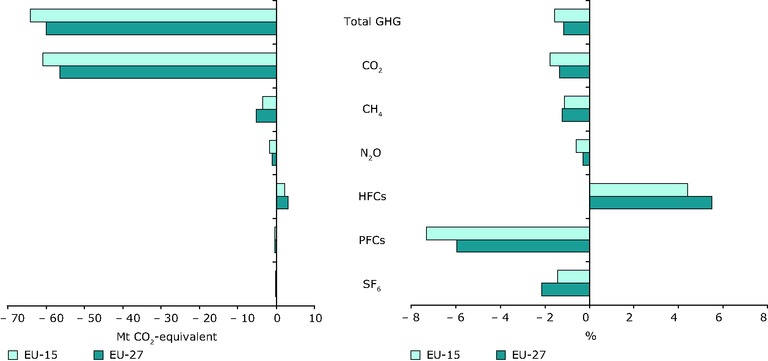
See all EU institutions and bodiesChanges in EU greenhouse gas emissions by gas, 2006–2007
Loading
All official European Union website addresses are in the europa.eu domain.
See all EU institutions and bodiesChart (static)
Changes in EU greenhouse gas emissions by gas, 2006–2007
