All official European Union website addresses are in the europa.eu domain.
See all EU institutions and bodies
- БългарскиBG
- češtinaCS
- HrvatskiHR
- danskDA
- NederlandsNL
- ελληνικάEL
- EnglishEN
- eestiET
- SuomiFI
- FrançaisFR
- DeutschDE
- magyarHU
- ÍslenskaIS
- italianoIT
- LatviešuLV
- lietuviųLT
- MaltiMT
- NorskNO
- polskiPL
- PortuguêsPT
- RomânăRO
- slovenčinaSK
- SlovenščinaSL
- EspañolES
- SvenskaSV
- TürkçeTR
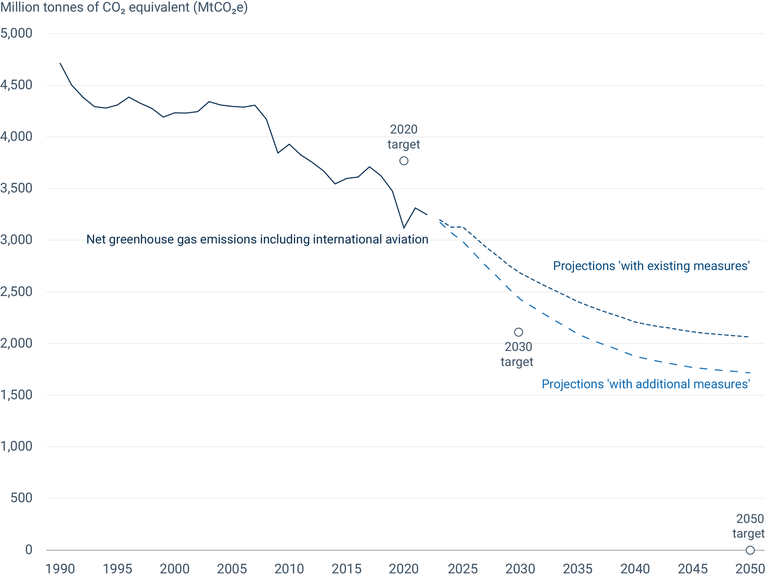
Progress towards achieving climate targets in the EU-27
Chart (static)
This figure shows the historical and future trends in net greenhouse gas emissions (including international aviation) for the EU-27, alongside key targets for 2020, 2030 and 2050.

- Member States' greenhouse gas (GHG) emission projections, 2023
- Approximated estimates for greenhouse gas emissions, 2022
- Austria
- Belgium
- Bulgaria
- Croatia
- Cyprus
- Czechia
- Denmark
- Estonia
- Finland
- France
- Germany
- Greece
- Hungary
- Ireland
- Italy
- Latvia
- Lithuania
- Luxembourg
- Malta
- Netherlands
- Poland
- Portugal
- Romania
- Slovakia
- Slovenia
- Spain
- Sweden
Additional information
The net EU Greenhouse Gas (GHG) emissions shown in this figure include emissions from Land Use, Land Use Change, and Forestry (LULUCF) activities, as well as emissions from international aviation, in line with the EU Nationally Determined Contribution as submitted in 2020. The 2022 value is based on approximated inventory reports. The GHG projections are based on the most recent data submitted by Member States in March 2023 under article 8 of the Governance Regulation. The 2020 target, defined without taking into account LULUCF emissions and removals, has been translated into a net emissions target by multiplying net 1990 emissions with 80%, while the 2030 and 2050 targets correspond to the reduction objectives of -55% and climate neutrality, respectively, as included in the European Climate Law.
