All official European Union website addresses are in the europa.eu domain.
See all EU institutions and bodiesAn official website of the European Union | How do you know?
Environmental information systems
EN
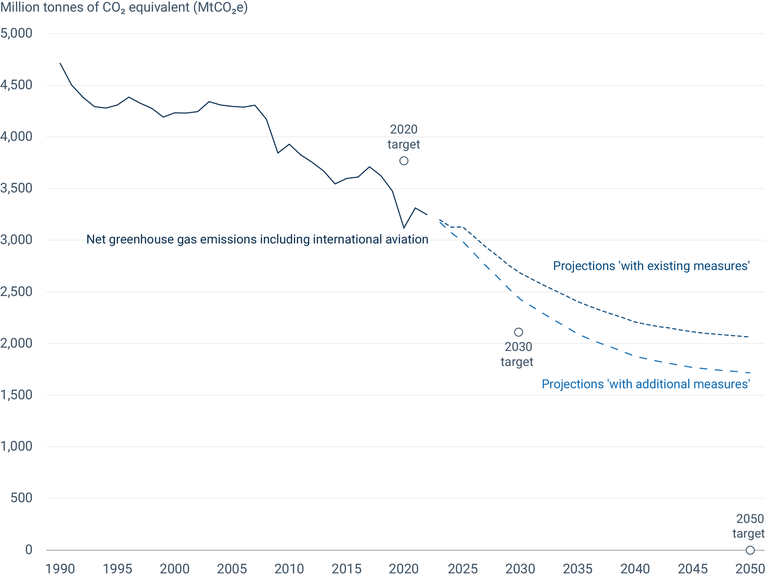
This figure shows the historical and future trends in net greenhouse gas emissions (including international aviation) for the EU-27, alongside key targets for 2020, 2030 and 2050.
Loading