All official European Union website addresses are in the europa.eu domain.
See all EU institutions and bodiesAn official website of the European Union | How do you know?
Environmental information systems
EN
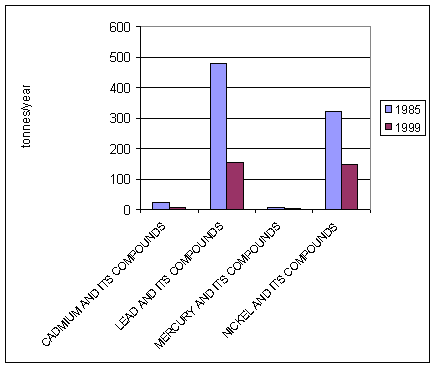
Only countries with data from all periods included: Switzerland, Germany, Denmark, Netherlands, Norway, Sweden.
Loading