All official European Union website addresses are in the europa.eu domain.
See all EU institutions and bodies
An official website of the European Union | How do you know?
Environmental information systems
EN

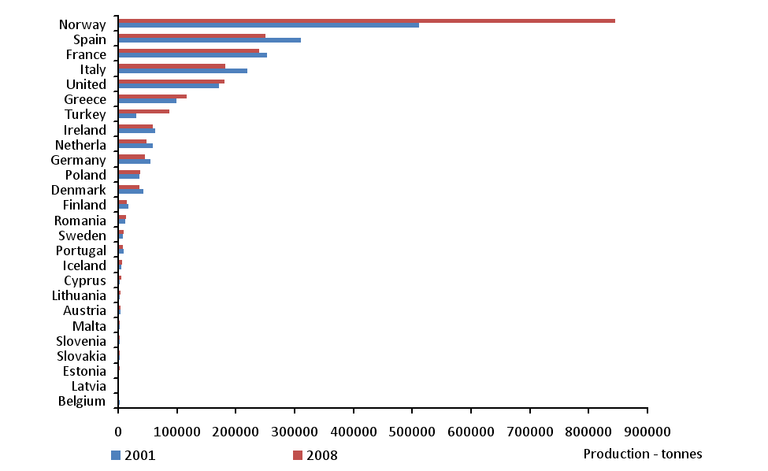
The figure shows the annual aquaculture production by country for 2001 and 2008
Loading