All official European Union website addresses are in the europa.eu domain.
See all EU institutions and bodies
An official website of the European Union | How do you know?
Environmental information systems
EN

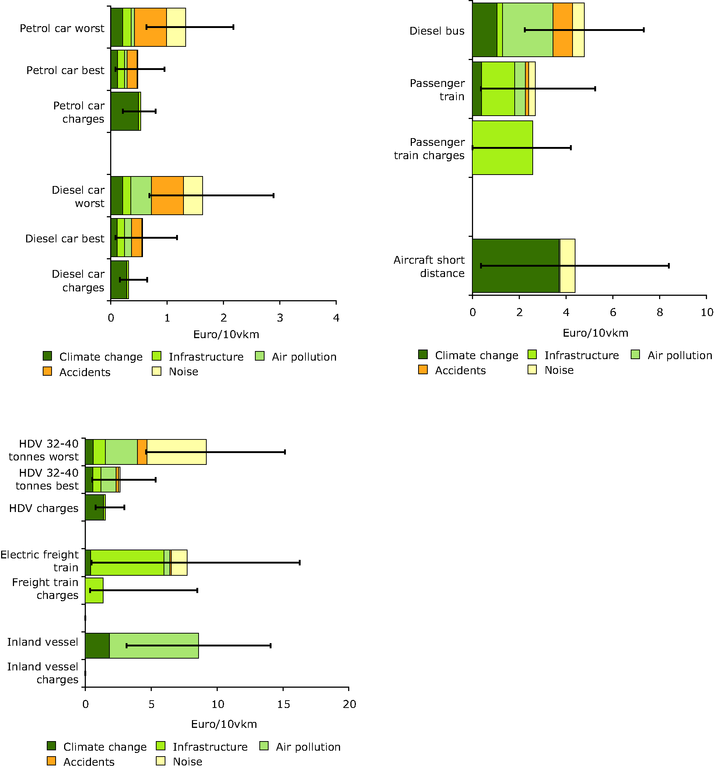
The three figures show estimates for the external costs of different modes of transport disaggregated on impact categories
Loading