All official European Union website addresses are in the europa.eu domain.
See all EU institutions and bodies
An official website of the European Union | How do you know?
Environmental information systems
EN

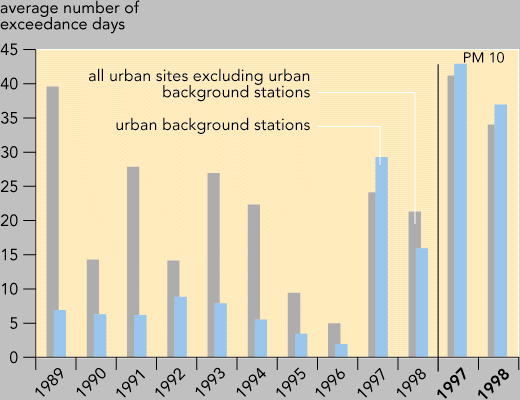
Exceedance days are defined as days with black smoke (BS) 24-hour average concentrations above 125 ?g/m 3 ; Total Suspended Particles (TSP) 24-hour average above 120 ?g/m 3 ; PM10 24-hour average above 50 ?g/m
Loading