All official European Union website addresses are in the europa.eu domain.
See all EU institutions and bodiesAn official website of the European Union | How do you know?
Environmental information systems
EN
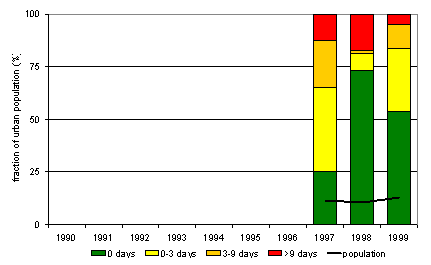
Monitoring data for accession countries is - to a limited extent - available since 1997
Loading