All official European Union website addresses are in the europa.eu domain.
See all EU institutions and bodiesAn official website of the European Union | How do you know?
Environmental information systems
EN
- БългарскиBG
- češtinaCS
- HrvatskiHR
- danskDA
- NederlandsNL
- ελληνικάEL
- EnglishEN
- eestiET
- SuomiFI
- FrançaisFR
- DeutschDE
- magyarHU
- ÍslenskaIS
- italianoIT
- LatviešuLV
- lietuviųLT
- MaltiMT
- NorskNO
- polskiPL
- PortuguêsPT
- RomânăRO
- slovenčinaSK
- SlovenščinaSL
- EspañolES
- SvenskaSV
- TürkçeTR
Exposure of ecosystems to eutrophication
Map (static)
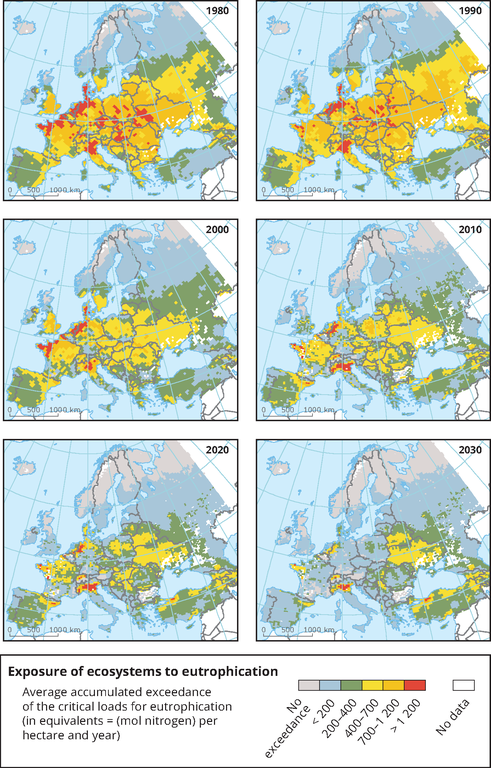
The maps show areas where critical loads for eutrophication of freshwater and terrestrial habitats are exceeded (CSI 005) by nitrogen depositions caused by emissions between 1980 (top left) and 2030 (bottom right)

Downloads
Data sources
Metadata
More info
Loading
- Exceedance of critical loads for the most sensitive ecosystems (dataset URL is not available)
- Albania
- Austria
- Belgium
- Bosnia and Herzegovina
- Bulgaria
- Croatia
- Cyprus
- Czechia
- Denmark
- Estonia
- Finland
- France
- Germany
- Greece
- Hungary
- Iceland
- Ireland
- Italy
- Kosovo (UNSCR 1244/99)
- Latvia
- Liechtenstein
- Lithuania
- Luxembourg
- Malta
- Montenegro
- Netherlands
- Norway
- Poland
- Portugal
- Romania
- Serbia
- Slovakia
- Slovenia
- Spain
- Sweden
- Switzerland
- North Macedonia
- Turkey
- United Kingdom
1980
1990
2000
2010
2020
2030
Units
Average accumulated exceedance of the critical loads for eutrophication (in equivalents = mol nitrogen per hectare and year)
Additional information
Link to indicator 'Exposure of ecosystems to acidification, eutrophication and ozone (CSI005)'
Link to the Coordination Centre for Effects (CCE), LRTAP Convention
https://www.umweltbundesamt.de/en/Coordination_Centre_for_Effects