Figure
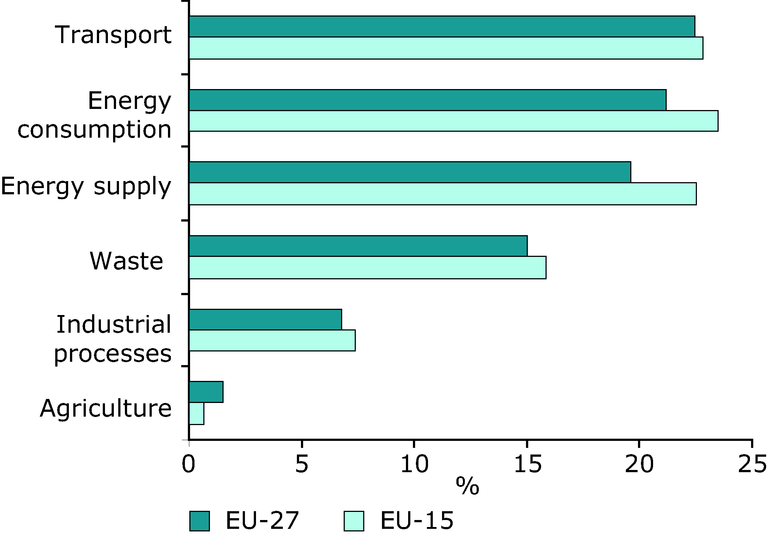
Expected savings from implemented and planned policies in 2020 as a proportion of 2007 emissions
Additional information
All policies and measures included, whether or not related to EU policies.
Permalinks
- Permalink to this version
- 9bfadb6fd38fa33eda100c925c7d8ac2
- Permalink to latest version
- Z602PAKCTP
Geographic coverage
Temporal coverage
For references, please go to https://www.eea.europa.eu/data-and-maps/figures/expected-savings-from-implemented-and-planned-policies-in-2020-as-a-proportion-of-2007-emissions or scan the QR code.
PDF generated on 07 Feb 2023, 12:59 PM
Document Actions
Share with others