All official European Union website addresses are in the europa.eu domain.
See all EU institutions and bodies
An official website of the European Union | How do you know?
Environmental information systems
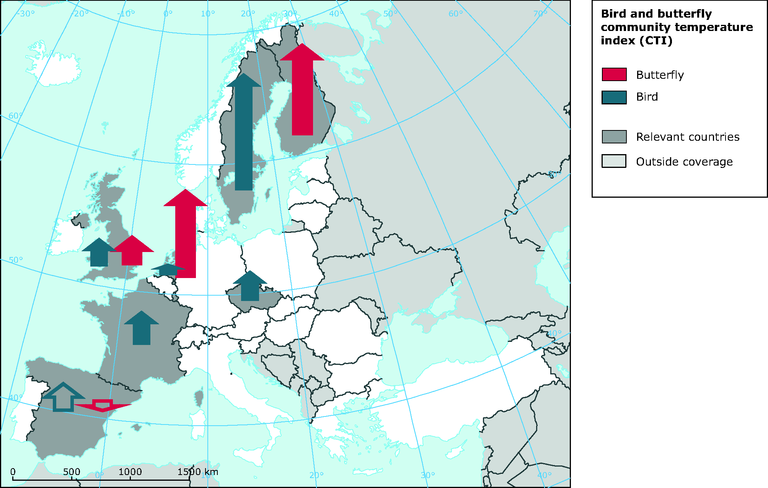
The map shows the temporal trend of bird and butterfly CTI for each country. A temporal increase in CTI directly reflects that the species assemblage of the site is increasingly composed of individuals belonging to species dependent on higher temperature. The height of a given arrow is proportional to the temporal trend and its direction corresponds to the sign of the slope (from south to north for positive slopes). The arrow is opaque if the trend is significant.
Loading