next
previous
items

Figure

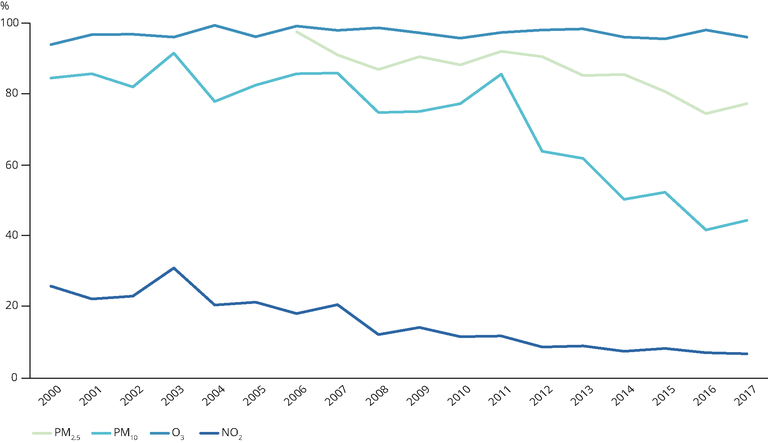
EU urban population exposed to air pollutant concentrations above selected EU air quality standards and WHO AQ guidelines

Figure Created 10 Dec 2019 Published 11 Dec 2019 Last modified 12 Aug 2020
1 min read
The rationale for selection of pollutants and corresponding WHO guidelines is given in the specification section of indicator CSI 004.

Metadata

Additional information

- Percentage of population exposed to annual PM2.5 concentrations above 10 µg/m3.
- Percentage of population exposed to annual PM10 concentrations above 20 µg/m3.
- Percentage of population exposed to maximum daily 8-hour mean O3 concentrations exceeding 100 µg/m3 for at least one day a year.
- Percentage of population exposed to annual NO2 concentrations above 40 µg/m3.

Permalinks

Geographic coverage

Temporal coverage

Document Actions