All official European Union website addresses are in the europa.eu domain.
See all EU institutions and bodiesAn official website of the European Union | How do you know?
Environmental information systems
EN
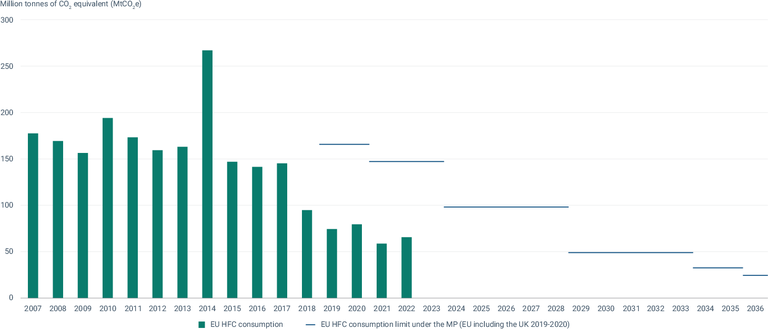
This graph shows the EU contribution to the global phase-down of HFCs under the Kigali Amendment to the Montreal Protocol, which introduces limits to the consumption of HFCs, starting in 2019. HFC, hydrofluorocarbon; Mt, million tonnes. HFCs covered under the Montreal Protocol do not include HFC-161. A country’s baseline for the Montreal Protocol HFC phase-down is defined as the average HFC consumption during the period 2011-2013, plus 15% of the HCFC baseline in 1989, all expressed in million tonnes (Mt) CO2 equivalent. As set out in the Montreal Protocol, the HCFC baseline also includes 2.8% of 1989 chlorofluorocarbon (CFC) consumption.
Loading